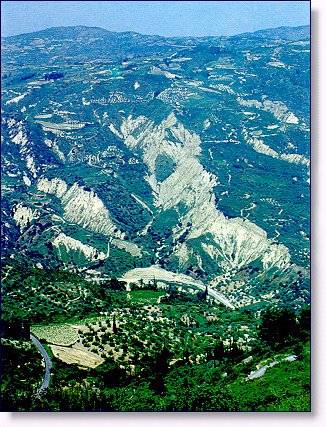
A series of high resolution satellite from LANDSAT-TM was compiled enabling to analyse seasonal and interannual changes of important indicators of environmental changes. Data are geo-coded and a first analysis was carried out dealing with changes on Normalized Difference Vegetation Index (NDVI). Resampling of results from high resolution of 30 m to a NOAA-AVHRR-equivalent coarse resolution of 800 to 1000 m shows how small-scale features influence reflectance in the coarse resolution. This is especially important to know before NOAA-AVHRR data are interpreted, since desertification starts in small niches where the environmental stability is lowest. Badlands are only one example of this process as the following Figure shows.
From April 20 to May 3, 1997, a field campaign was carried out in the research area in Tuscany, close to Campiglia M.tma. The components of the radiation and the energy budget of a wheat field were measured during a 10 day period. Additionally several experiments to investigate instrumental and methodical problems of land surface flux measurements were included. The data set was analyzed with respect to the different aspects of the field campaign. The LANDSAT-TM overpass on April 30 was not usable due to cloudy weather.
During the first year of RESMEDES the research group succeeded to compile several LANDSAT-TM data of cloudfree situations for the Tuscany testsites Campiglia and Radicondoli. The data were made available by partner AGEO.CESIA on the central RESMEDES-server at Florence and transferred via FTP to the computer center at MCR Lab Basel. Two important time series which are at present available make it possible to investigate :
The data are geocoded and are stored in the IDRISI file format. IDRISI is an grid-based Geographical Information System (GIS) of Clark University Graduate School of Geography, Worcester/MA. During a coordination meeting in April at Florence it was decided to use this GIS as a general base for file structure and exchange of data and results.
In addition to these satellite data a digital terrain model (DTM) of the whole of Tuscany with a grid size of 250 m and high resolution DTMs of both testsites at Campiglia and Radicondoli were ordered from the Regione Toscana offering a grid size of 20 m. This high-resolution DTM fits to the pixel resolution of LANDSAT-TM data. Slope and aspect were calculated and made available for the research community.
In the Colline Metallifere area emphasis lies on the validation and interpretation of the primary information (reflectance, temperature, vegetation index, type of vegetation) inferred from satellite data (RESMEDES Circular No. 1). It was decided, to carry our one or two field campaigns at two locations in the test area to sample ground truth data to support the interpretation of satellite data. The campaign in spring 1996 was placed around the LANDSAT-TM overpass on April, 30, 1996. The goals were
Two partners, the MCR Lab, Department of Environmental Sciences, University of Basel (UBAS.DGEO) and the Institut für Meteorologie der Freien Universität Berlin (FUBE.IM), participated the spring campaign. Additionally a group from the Institut für Hydrologie und Meteorologie, Lehrstuhl Meteorologie, der Technischen Universität Dresden, joined the field campaign.
At the inland site near Radicondoli (R, see Fig. 1) the group from Berlin was active. The groups from Basel and from Dresden performed their investigations at the Campiglia M.tma site. In the following it will only be reported on the activities of the latter two groups done at the C-site during the spring campaign.
Figure 1 gives an overview on the Colline Metallifere area. The C-site is located South of Campiglia M.tma near Cafaggio in the plain close to the river Cornia (43°02’26“N/10°39’21“E; 20 m a.s.l.)

The measurements were carried out in the center of a winter wheat field which was approximately 500´200m and was oriented NE to SW. After having done almost half of the field the farmer had to stop sowing for several days due to bad weather conditions.This lead to the fact that the canopy was divided into a more and a less developped one. The height of the denser part was at the beginning » 0.4 m and grew after 12 day to » 0.6 m. The canopy was closed and the soil not visible from above. The less dense part grew from 0.3 to 0.5 m and the soil between the plants was visible.
In Fig. 2 the landuse within the radius of 500 m around the experimental site can be seen.
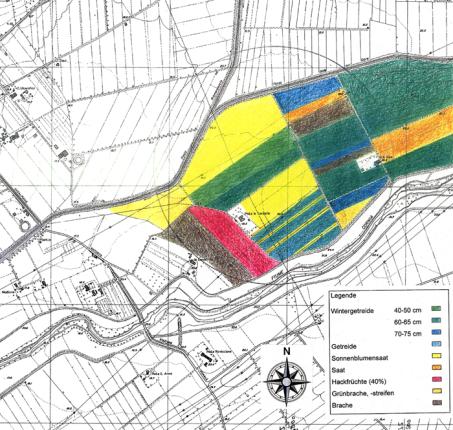
Fig. 2: Landuse around the experimental site.
According to the initial intention, to measure the components of the radiation balance
Rn = Rsd - Rsu + Rld - Rlu
where R denotes total radiation, the subscripts n, s and l indicate net, short wave and long wave radiation and the subscripts d (downward) and u (upward) indicate the direction of the flux , two radiation set-ups were placed in the field. The Dresden group measured in the less dense part, the Basel group placed their sensors in and above the denser part of the field (for details of the instrumentation see Tab. 1). There were redundant measurements of all compontents of the radiation budget to assess the uncertainty and also to be able to check different calibration procedures. Additionally the soil heat flux (G) was measured using three heat flux plates buried at »0.05 m.
Both groups carried out flux measurements during the whole period applying the eddy covariance method. The first (u, v, w, t, q: wind vector, temperature and absolute humidity) and second moments (sensible heat (H), latent heat (LE) and momentum (t)) were stored as half hourly values. Instrumental details can be inferred from Tab. 1.
During selected periods a scintillometer was functioning and measured momentum and sensible heat flux along a 100 m path. The Basel group installed a 10 m mast to measure profiles of temperature, humidity and wind speed. Wind direction, precipitation and air pressure were also sampled and all data were stored as 10 min averages.
At the end of the period, six ultrasonic-anemometer-thermometers (=sonics) were intercompared by operating the instruments for two days side by side and storing the raw data.
| Basel: radiation budget | manufacturer | serial number | variable |
| 2 pyrgeometer | Eppley PIR | 30323F3,31207F3 | Rld |
| 1 pyrgeometer | Eppley PIR | 28962F3 | Rlu |
| 2 pyranometer | Kipp & Zonen CM21 | 910004, 950239 | Rsd |
| 1 pyranometer | Kipp & Zonen CM11 | 935142 | Rs |
| 1 pyrradiometer | Schenk Mod. 8111 | 8472 | Rn |
| 3 heat flux plates | McVan instruments | soil heat flux | |
| Basel: eddy covariance | manufacturer | serial number | variable |
| 1 sonic | Gill-Solent Enhanced | 9 | H, LE, t, u, v, w, t’ |
| 1 thermocouple | Campbell 12.5 mm | t’ | |
| 1 Krypton Hygrometer | Campbell KH2O | 1098 | q’ |
| Basel: scintillometry | manufacturer | serial number | variable |
| 1 scintillometer | Scintec SLS 20 | x | H,t |
| Basel: sonic intercomparison | manufacturer | serial number | variable |
| 3 sonics | Gill-Solent R2 | 35, 36, 43 | H, t, u, v, w, t’ |
| 1 sonic | Kaijo Denki | H, t, u, v, w, t’ | |
| 1 sonic | Campbell CSAT3 | 118 | H, t, u, v, w, t’ |
| 1 sonic | Applied Technologies | H, t, u, v, w, t’ | |
| Basel: profile | manufacturer | serial number | variable |
| 12 cup anemometer | Vaisala WAA15 | 6 levels | wind speed |
| 1 wind vane | Vaisala WAV15 | wind direction | |
| 6 temp.+humidity sensors | Vaisala HMP35A | 6 levels | t, q |
| 1 rain gauge | Campbell ARG100 | precipitation | |
| 1 air pressure | Vaisala air | pressure | |
| Dresden: radiation budget | manufacturer | serial number | variable |
| 1 pyrgeometer | Eppley PIR | PyrD | Rld |
| 1 pyrradiometer | Schulze-Däke | Rn | |
| 1 pyranometer | Kipp & Zonen CM21 | G1 | Rsd |
| 1 albedometer | Kipp & Zonen CM7 | GR, GA | Rsd,Rsu |
| 1 pyrometer | Heimann KT15 | Rl, surface temp. | |
| 1 cup anemometer | wind speed | ||
| 1 temp.+humidity sensor | Vaisala HMP35A | t, q | |
| 2 heat flux plates | soil heat flux | ||
| Dresden: eddy covariance | manufacturer | serial number | variable |
| 1 sonic | METEK USA1 | H, t, u, v, w, t’ | |
| 1 1D-sonic | Campbell CA27 | H, w’, t’ | |
| 1 Krypton Hygrometer | Campbell KH2O | q’ |
Figure 3 gives an overview on the distribution on the experimental setups in the wheat field. The profile mast (2) stood right on the border between the denser (left in Fig. 3) and the less denser part of the field. Except the radiation measurements of the Basel group (1) all other activities took place in the part of the field with the less dense canopy. The length of the scintillometer path was 100 m.
The weather during the campaign was mostly influenced by low pressure systems and consequently it was rainy and cloudy with temperatures in the range of 10 to 20°C. The weather was far from being ideal to do micrometeorological measurements. It was impossible to install the spectroradiometer to measure the spectral albedo. The prevailing wind directions were downvalley from NNE and from the coast (NW). There was no see breeze observed. The water vapor pressure ranged from 15 to 20 hPa and the water vapor saturation deficit was relatively low with peak values around 10 hPa. In Fig. 4 the course of the meteorological elements during the measurement period are displayed.


The Basel group made redundant measurements of Rsd and Rld using two pyranometers and two pyrgeometers (see Tab. 1). Between the pyranometers there was a difference of 2.8°% (not shown). After the field campaign #950239 was calibrated at the World Radiation Center, Davos, and its calibration factor had been confirmed. The other pyranometer belongs to the very first which were produced, and inquiries at the producer revealed, that there were problems with the first 24 instruments produced. Between the pyrgeometers there were only slight (if one is interested only in net radiation) but puzzling differences. We chose instrument #207 as a reference.
The different measurements of the longwave downward radiation are intercompared relative to the reference in Fig. A.4. The reference is always subtracted and the differences are plotted versus the absolute value of the reference and versus daytime. In Fig. 5 top-left one can see the systematic difference to #323 which is roughly 10 % of 80 Wm-2 change in Rld. Both instruments were recalibrated and still show the same difference. The differences to the values from the pyrgeometer of the Dresden (PyrgD) group scatter between -10 and 5 Wm-2, but the plot versus daytime shows that there is a time dependent influence, which is possibly due to not making a proper dome correction. Rld with the PyrgD was calculated using only one dome factor while to the other instruments a more elaborated calibration procedure was applied. In general it can be stated, that there is a good agreement between the different measurements of the long wave components.


The agreement between the measured short wave components was excellent and differences are displayed in Fig. 6. The deviations were in the range of ±10 Wm-2. In Fig. 6 (bottom) one can see, that the reflected global radiation is larger above the part of the field with the closed canopy. In the less dense part bare soil absorbs more short wave radiation and this leads to a difference in albedo of 2-3 %.
The albedo values are plotted in Fig. 7 and are 23 and 21 % for the dense and the less dense canopies, respectively.
The net radiation in the denser field was calculated using the measurements of the four components of the radiation balance. Net radiation from the less dense part was measured with the Schulze-Däke pyrradiometer. It could be expected that there is a lower net radiation at the location with the denser canopy due to the higher albedo. However, calibration of net radiometers bears still some uncertainty and it is difficult to discriminate between instrumental and real effect. In Fig. 8 the differences are plotted. It can be seen, that the less dense part has higher values in the range of 20 to 30 Wm-2. At two days, however, the differences amount up to unrealistic 40 to 60 Wm-2. The reason for that remains unclear.

The energy balance of the wheat field can be approximated by
Rn = H + LE + G
All components of the energy balance equation were measured continuously during the field campaign. The mast was located in the less dense part of the field (see Fig. 3). The course of the measured components are displayed in Fig. 9. The Bowen ratio was typically around 0.2 to 0.5 which means that LE dominated the turbulent heat fluxes. Peak values of Rn, H, LE and G were around 600, 300, 100 and 30 Wm-2.
Theoretically, the turbulent heat fluxes H+LE should sum up to the available energy Rn-G. Figure 10 gives an idea of how good the energy balance is closed according to the measurements. Half hourly values of H+LE are plotted against the available energy Rn-G and the straight line indicates the 1:1 line. There is an obvious lack of closure and it is relatively large: H+LE account for only »60 % of the available energy. It is a well known phenomena, that the energy balance fails to close, but such a large gap was not expected. Intercomparisons with the measurements of the soil heat flux carried out by Dresden group indicated, that the measurements of the Basel group might be to small. And also the measured sensible heat fluxes from the other sonics during the sonic intercomparison were showing, that H measured continuously might be underestimated seriously (up to 60 to 80 Wm-2 for peak values). But even if we assume that H and G were underestimated by 50 %, this would only account for » 20 % of the closure gap. It is likely that, apart from instrumental problems, the heterogenetiy in the surrounding contributes to the gap. Looking at Fig. 3 reveals that the fluxes measured at the mast (Pos. 3.) were probably only partly representative for the wheat field. And as part of the source area of the fluxes was also the bare field with sunflower sowing, it is likely that LE was underestimated too.


For selected periods the scintillometer was working. The sensible heat fluxes from the scintillometer agreed relatively well with the continuous flux measurements. These values were, however, much smaller than those which came from the additional sonics which were installed for the purpose of intercomparison for two days. The sensible heat fluxes measured by these sonics were 50-80 % larger during daytime. Details of the intercomparisons will be presented in Vogt et al. (1997a, 1997b).
After preprocessing of satellite data a first set of images was analyzed. The normalized difference vegetation index of the scenes from June, August and November 1990 was computed. A further step was to tackle with change detection concerning NDVI between June and August respectively August and November 1990. These work steps have to be compared with pixel resolution which are equal or equivalent to NOAA-AVHRR data. It can clearly be shown that the variations in landuse within a small distance are influencing the large resolution of NOAA very much and that agricultural fields control the NDVI changes completely different as compared to forests. The following figures shall demonstrate the difference between LANDSAT-TM and NOAA-AVHRR resolution and point out to investigate environmental processes in the subpixel range of NOAA-AVHRR data.


The following figs. 12 and 12 show the change detection of NDVI between June 1 and August 8m 1990 in full LANDSAT-TM resolution and resampled to a NOAA-equivalent resolution of 810 m. The colour black represents no change, the dark grey tones (e.g. the forest) indicate an increase of NDVI, the light tones (e.g. agricultural fields) indicate a decrease of NDVI.


Ratios and also the NDVI which is the normalized difference of infrared and red satellite data according to the formula
NDVI = (IR - RED)/(IR + RED)
should normally be insensible to topographical influences of illumination effects. This is illustrated quite well in Fig. 14 (left) . But the NDVI-image of November 1990 is contaminated with topographical and illumination effects, which also influence the analysis of NOAA-AVHRR data. Figure 14 (right) shows the NDVI-image of November 8, 1990 of the testsite Campiglia. In the mountainous areas in the north-west and south-east north-sided slopes are darker than south-oriented slopes. This effect has to be considered in the future work before changes of NDVI are interpreted.


The following series of images show the surface temperature of the LANDSAT-TM scenes of June 1, August 4 and November 8, 1990.


Additional ground truth activities: field campaign in 1996.
Initially it was planned to do the field measurements as part of another EU-project (SAPHIR) and to use them as ground truth. This project, however, did not get funded, and because the reviewers were critizising, that in RESMEDES there are no ground truth measurements, it was decided, to change the work plan and to include at least one field campaign in the Tuscany area within the RESMEDES activities. The first field campaign, which was prepared in early 1996 and carried out from April 20 to May 3, 1996, was not very successful in terms of providing ground truth data for the LANDSAT-TM overpass from April, 30: the weather was cloudy and consequently the scene could not be used.
Second field campaign in 1997
In deviation from our work plan, a second additional field campaign is planned end of August/early September 1997 in the Colline Metallifere area, Tuscany. The campaign will be carried out together with the Winand Staring Center (H. De Bruin as subcontractor).
According to the work plan the existing LANDSAT data shall be analysed in the way that besides NDVI additional biotic parameters shall be computed like photosynthetic active radiation (PAR) and leaf area indices (LAI). In combination with numerical radiation models and the digital terrain models radiation fluxes and all wave net radiation shall be investigated for all data samples including saisonal and interannual variations. Contacts have be established to the German satellite data receiving station of DLR at Neustrelitz/FRG and the private company Euromap/Neustrelitz, which offer satellite data of IRS, MSU and WiFS with a medium resolution between 80 and 300 m. These Indian and Russian satellites have a very high potential to bridge the gap between LANDSAT-TM and NOAA-AVHRR.
At the end or August 1997 a second field campaign in the research area in Tuscany is planned. The preparation are ongoing. The spectroradiometer will be used to sample during the second campaign a dataset of spectral albedo for different surface covers. Two to three energy balance stations will be installed to compare their estimates with fluxes measured by a scintillometer.
Dr. R. Vogt: March 26 to 27, 1996. Inspecting the possible field sites in the Colline Metallifere area (Campiglia M.tma and Radicondoli).
Prof. E. Parlow: April, 25 to 26, 1996. Visiting the field activities close to Campiglia M.tma. Meeting with Prof. Maracchi, Prof. Bolle and Dr. Maselli in Florence, to discuss the data exchange.
Dr. R. Vogt: RESMEDES-Workshop in Florence, 22 to 24 August, 1996
Dr. R. Vogt: RESMEDES-seminar in Dresden, December, 6 to 7, 1996. Presentation of first results of the RESMEDES field campaign in spring 1996.
Schwiebus, A. (1996): Auswertung der Bodendaten einer Messkampagne in der Toskana im Frühjahr 1996. Technische Universität Dresden. Institut für Hydrologie und Meteorologie. Dresden.
Instrumentenpraktikum Sommersemester 1996 in Campiglia Marittima (1996). Ein Praktikumsbericht. Universität Basel, Departement Umweltwissenschaften, Basel.
Vogt, R., Feigenwinter, Chr., Parlow, E. (1997a): Towards a traceable measurement of net radiation. Accepted for oral presentation at the EGS meeting in Vienna, April 21 to 25, 1997.
Vogt, R., Feigenwinter, Chr., Paw U, K.T., Pitacco, A.(1997b): Intercomparison of ultrasonic anemometers. Accepted for oral presentation at the 12th Symposium on Boundary Layers and Turbulence, 28 July - 1 Aug 1997, UBC, Vancouver, British Columbia, Canada.